Posted on 9/24/2015 in Digital Marketing
By wakefly
Google Analytics is one of the most useful tools for a marketer if used correctly. The tool can be tailored to give you data on just about anything. Most marketers know how to get data on views, sources, and conversions, but there is so much more it can do.
I wanted to share 4 different google analytics capabilities and how to utilize them to help you get the most out of the tool:
1. Site Search Reporting
The site search function has a few ways to help you understand the consumer’s intent. Being able to see their on-site searches enables you to gain insights into what they are looking for on your website, but can’t find on the website. You can also figure out what information they need to know before making a purchase decision, what pages could be built out further, and a lot more.
This can really shed light on any “dead ends” users might be experiencing during their site navigation.
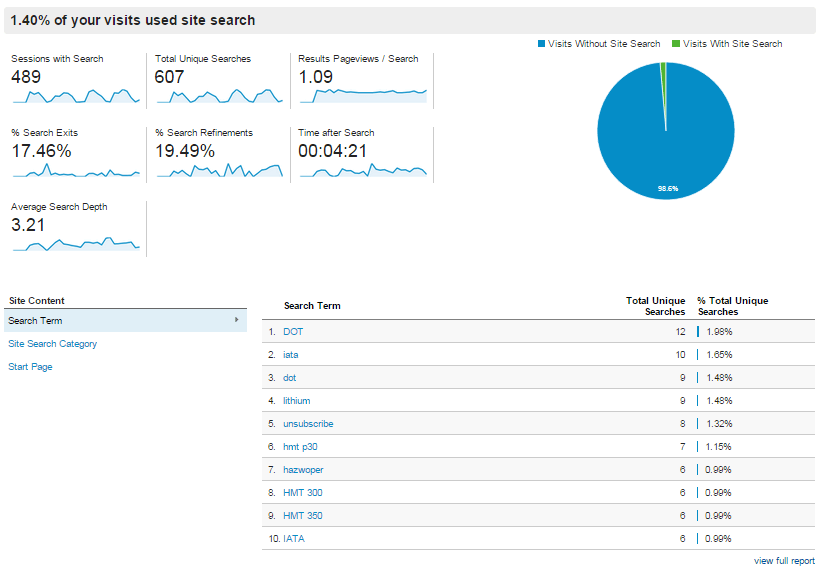
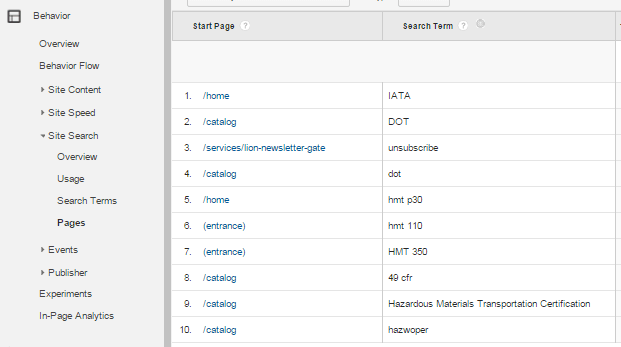
By enabling Site Search, Google Analytics can report what page the user searched from
The page viewed after searching the site is also seen in the reports. This shows the navigation path used by visitors to get to a specific place. This information is best used to optimize navigation to help users move through the site more conveniently.
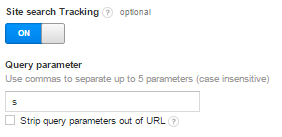
To enable site search, go under “Admin”, then “View Settings “ and click the button to turn Site Search Tracking on.
The Query Parameter is the letter or word following the “?” in the URL after a site search.
2. Blocking Referrer Spam
Referrer spam can skew data and make searching for legitimate data an annoyance. It also makes the “events” report seem messy and unprofessional when allowed to run alongside an actual event data collection. Being able to catch the Referrer Spam early can prevent a large number of spam events to show up in reporting.
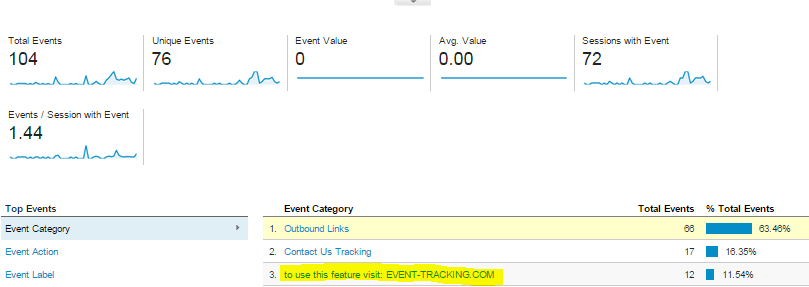
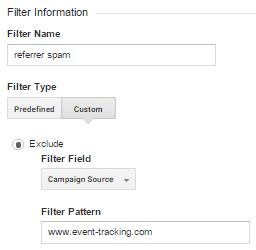
The most common spam I’ve seen is the “event-tracking.com” referrer. To filter out referrer “event” spam from continuing to add to future reports (since you can’t delete events once they’ve been recorded in Analytics), there are a couple of easy steps you can take:
Under “Admin”, add a new filter. Make sure to check the source that your referrer spam is coming from. Create a custom filter that excludes spam from the source.
Although you can’t delete the previous event entries from this in Google Analytics, you can still prevent the spam from increasing the total number of events.
3. Annotations
Have you ever seen a spike in page views, but you can’t place exactly what caused it? The only thing better than the spike is being able to tell your client that all your hard work is paying off! Adding annotations to Google Analytics will solve all your mystery peaks and valleys.
Although it is often hard to remember to do, it is vital to creating accurate reports. There are a few best practices when it comes to writing annotations.
- Be specific about the action taken: Just saying “updated page copy” isn’t enough. What pages did you update? What keywords did you add? Be as explicit and detailed as you can within the character limit they allow. Also, keep in mind that anyone could be reading it. Your shorthand notes or abbreviations may make sense for you, but could completely baffle someone else.
- Record any changes made to any type of campaign. Don’t just limit your notes to online paid and organic efforts. TV, radio, posters, or anything else that could potentially increase searches to your site should be recorded in annotations. Things like mentions on social media from leaders in that industry, social contests, or email blasts could all be included.
- Annotate all site maintenance, updates, or issues. Any website change could impact the tracking code. If there’s any drop-off in data, it’s best to have annotations to deliver an explanation to the client.
To add annotations, go under “Admin”, the “Annotations” and create a new annotation with the “+ New Annotation” button.

4. Benchmarking
If your client would benefit from receiving comparative data to other companies in their industry, creating a benchmarking report in Analytics is a quick and easy way to pull all that data together. With benchmarking, not only can you see how your business stacks up to competitors in your industry, but you can segment that data by device, location, and channels.

Channel data in the benchmarks report can answer a few important questions about the acquisition of your users.
Where do most of them come from? Should you increase your paid search or display budget? Are your social campaigns doing well compared to your competitors?
Location data is best utilized for international e-commerce sites that are competing in multiple countries. For businesses that focus primarily in one country, this feature won’t be very insightful.
Device data shows how your industry performs on different devices and how you stack up to those competitors. You’ll be able to see if your competitors are doing better than you on a mobile platform. This may let you know you may need to optimize your site better for mobile to catch up with others in the same industry.
If more businesses in your industry are seeing sessions on desktop, like a Finance company might, then desktop is the platform you would want to focus on.
To implement benchmarking, make sure to go into “Admin”, “Account Settings”, and check off “Benchmarking – Contribute anonymous data…”
Related Articles

Outdated or Outstanding? How to Tell If Your Website Needs a Refresh
Your website is the digital face of your business. It serves as a first impression, a marketing tool, and a resource for potential customers. [...]

Preparing a Website Redesign Budget for 2025: A Step-by-Step Guide
As we approach 2025, businesses are recognizing the necessity of a fresh, user-friendly website to stay competitive in a rapidly evolving digital [...]

Elevating Your Brand: The Transformative Power of Website Design
In the digital age, your website is often the first point of contact between your brand and potential customers. It's not just a platform to showcase [...]

