Posted on 12/15/2015 in Digital Marketing
This case study uses methods outlined in my blog post, The Ultimate Guide to Properly Tracking PDF Files and Presenting the Collected Data.
To illustrate a case, a few months ago we started to provide services for a Multi Million Dollar High Tech Company ( for privacy purposes, we will call them “B2B-High-Tech”. This start up company had a great product with enormous potential. Their website had a few URL’s, a small blog section, and highly valuable white papers in the PDF form.
Organic traffic was decent and the site mostly attracting visitors via branded key phrases. Most of such visitors were looking for product description, documentation on performance, and how products compared to competitors in the industry. The answers to these questions were in white paper documents in PDF format and scattered around their website.
The Problem
There was no tracking on these PDF’s, so senior management had no idea how the PDF files were performing. They weren’t sure if they were serving any purpose to web visitors or if they were being downloaded at all.
Because of that we started designing a complete reporting platform so Senior Management would have access to PDF data easily and provide valuable clues on what was going on.
Actions Performed
First, with Google Analytics in place, we implemented Google Tag Manager and made sure the pages with PDF files links in them had the correct container script.

The second step was to create the PDF events needed to enable reporting. Thus, using the Tag Manager platform, we created one trigger:
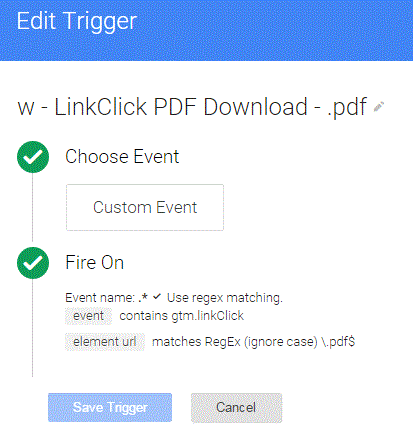
After creating the trigger that enables to track clicks to a PDF file in any page, we created the Tag to send the right information to Google Analytics reports via Events:
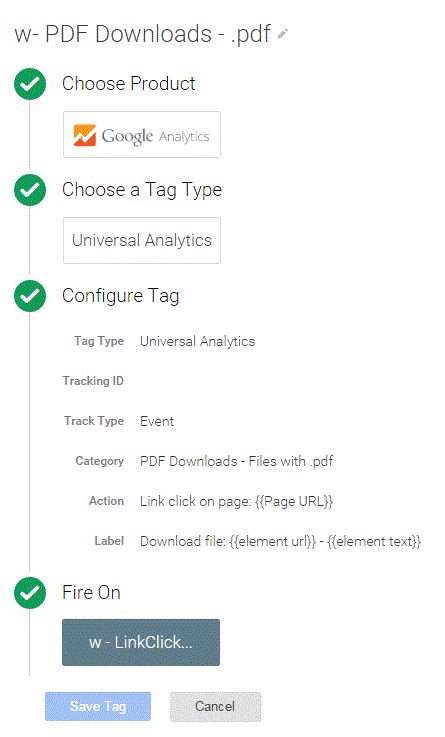
With the above Tag Manager configuration, the data started to flow to Google Analytics where we then created a PDF goal to track activity and performance of PDF files and campaigns.
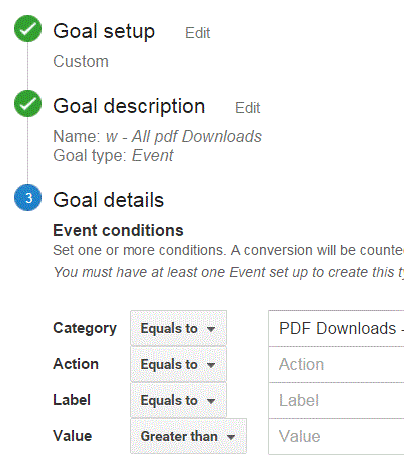
The above Tag Manager configuration enabled Google Analytics to start collecting PDF data. After a while we decided to create a dashboard so Senior Operatives would have easy access to data.
To tailor the report to our specific needs, we decided to use Google API to harvest the information. Using Google spreadsheet, available via Google Drive, and handy Add-ons, we configured the spreadsheet to harvest the data we needed.
To do this, we spent time creating the appropriate configuration for each specific report we need to build. As an example, in order to obtain the number of PDF downloads for November 2015, we created this configuration with the required Metric, dimension and filters to generate the November 2015 PDF events organized from most popular to less popular.
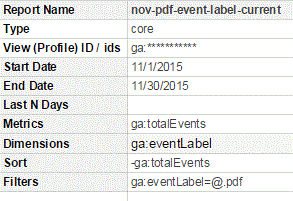
Here is another configuration, this time capturing the Goals data:
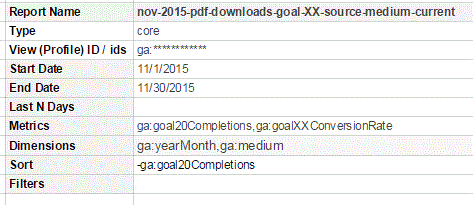
After creating all the configurations needed and running the reports, we had lots of raw data to work with. At this point, the challenge was to present the data in a way that would be easily accessible and digested by our Client’s Senior Executives.
To do that, we took advantage of Google Sites. In the Google Spreadsheets, we created charts and tables and then converted them to iframes which code can easily be embed in any html site. The result was a neat one page dashboard with all the charts and tables describing the following:
- Organic vs. Non-Organic PDF file Downloads per month.
- Monthly number of PDF Downloads and percent change based on the # of Goals achieved ( increase or decrease )
- Monthly PDF Goal conversion rate and percent change ( increase or decrease )
- Most Popular PDF file Downloads, weekly or monthly, compared to previous time period.
As examples, and taking the data harvested thanks to the configuration for November PDF files mentioned above, the dashboard was updated with the following:

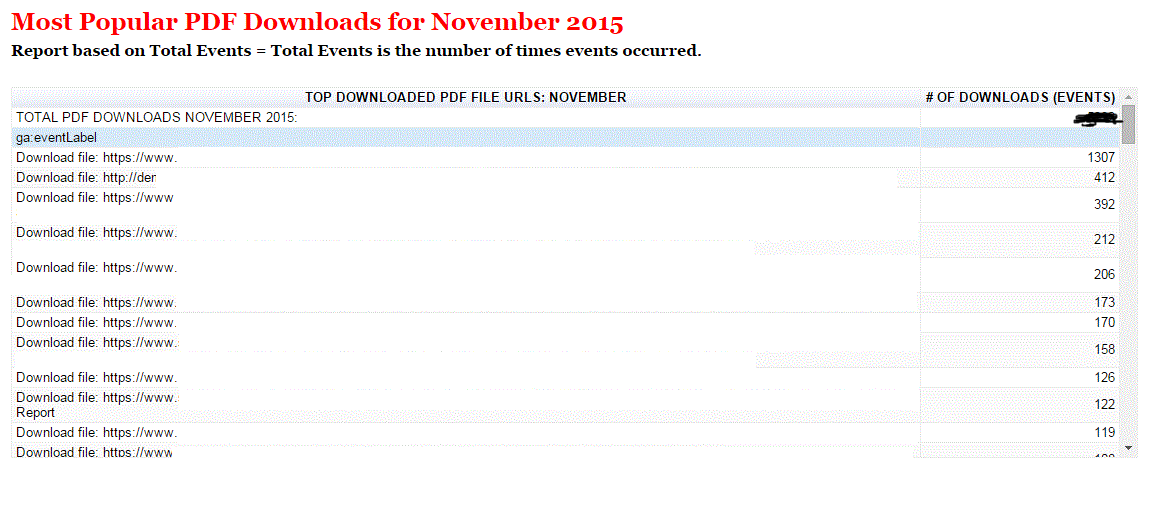
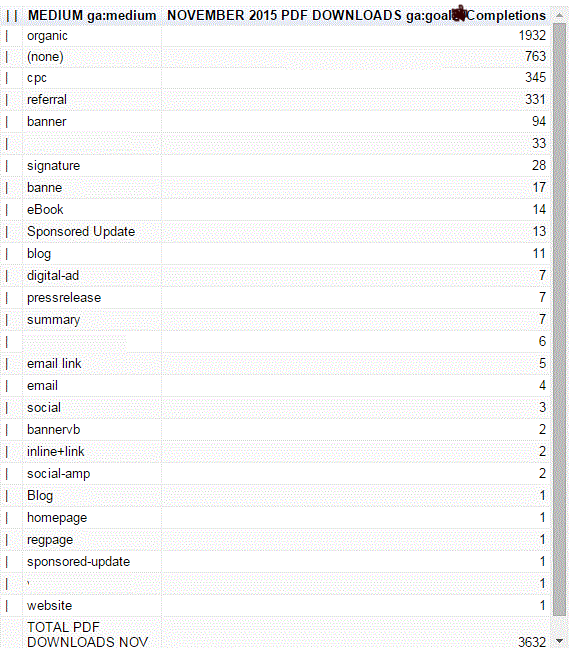
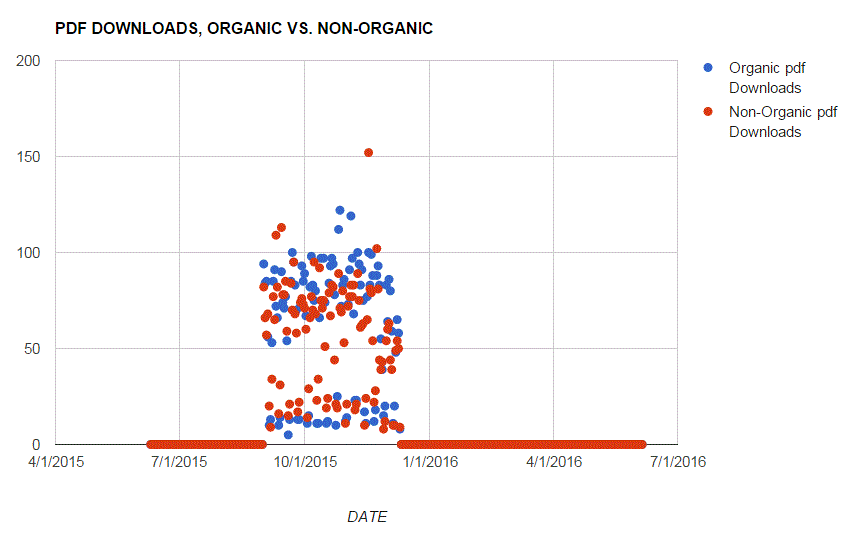
All the above charts and tables, plus others, were inserted in a Google Site page, via embed iframes, and presented to the client as a Google Sites URL. As the access is restricted, new users either from the client side or ours are added just by sending an email invitation. . The data is protected and can be easily shared and accessed by all parties in the email list.
Results
The end result was client satisfaction. Now they have an idea of what is going on with the PDF files and campaigns, and can easily access the detailed report online just by clicking a link, without having to access google Analytics and spend ours figuring out where the PDF file stats are.
Related Articles

Outdated or Outstanding? How to Tell If Your Website Needs a Refresh
Your website is the digital face of your business. It serves as a first impression, a marketing tool, and a resource for potential customers. [...]

Preparing a Website Redesign Budget for 2025: A Step-by-Step Guide
As we approach 2025, businesses are recognizing the necessity of a fresh, user-friendly website to stay competitive in a rapidly evolving digital [...]

Elevating Your Brand: The Transformative Power of Website Design
In the digital age, your website is often the first point of contact between your brand and potential customers. It's not just a platform to showcase [...]
